Culvert Installation Servicesin Ortonville MI
Tailored Culvert Installation Solutions for Reliable Water Flow
We Are Locally Owned & Operated For Over 37 Years
Contact Us Today!
We Serve Businesses In And Around The Following Cities:
About Culvert Installation Services
A Comprehensive Guide to Culvert Installation in Ortonville
For many commercial property owners and businesses in Ortonville, the relevance and value of professional culvert installation cannot be overstated. This civil engineering activity involved in modifying watercourses, drainage systems, and in facilitating robust property accessibility significantly influences the efficiency, safety, and overall aesthetics of your commercial properties.
Understanding Culvert Installation
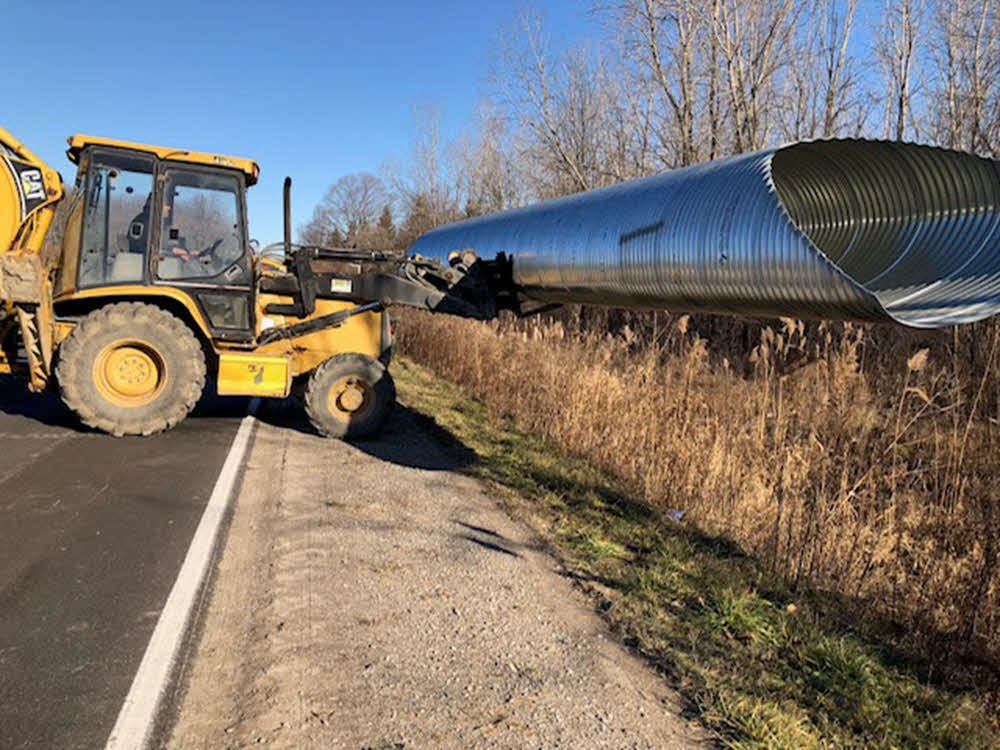
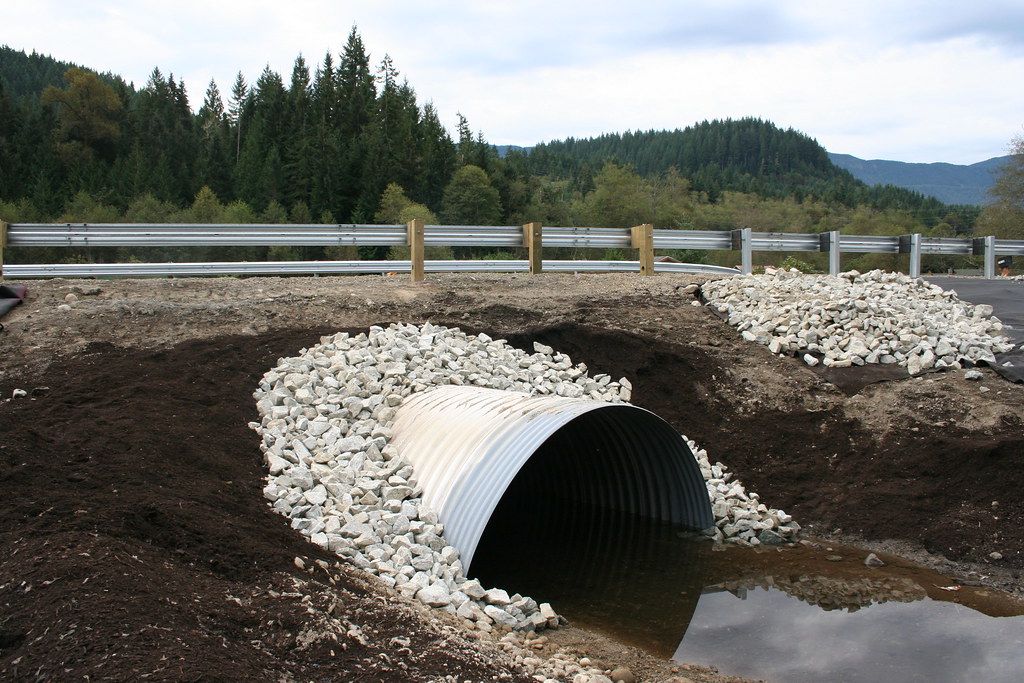
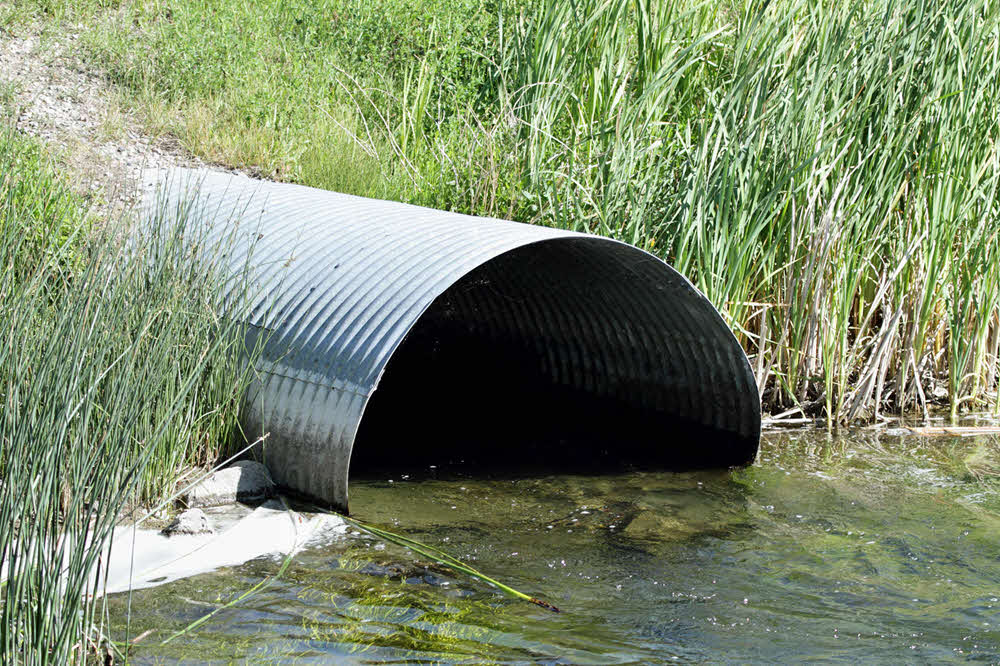
Essentially, putting in a culvert entails the construction of a structure that permits water to pass under a road, trail, or similar obstruction. The type of culvert installed, such as a culvert pipe or box culvert, depends on various factors including the volume and speed of flowing water, and the nature of obstruction. There are experienced culvert installation companies in Ortonville such as D&J Contracting, who offer a wealth of expertise in installing culvert pipes under driveways and can provide concrete driveway culvert ends. Working with professionals can ensure quality installation, minimizing risks associated with weather phenomena, improper drainage, and road displacement.
Benefits of Proper Culvert Installation
Culvert installation offers many advantages, particularly for properties in cities like Ortonville where effective stormwater management is crucial. A substantial benefit is the effective management of stormwater run-off – preventing flooding and erosion, making your commercial property safer and more accessible to clientele. Additionally, a well-installed driveway culvert increases property value and curb appeal. Importantly, enlisting professional services like those provided by D&J Contracting will assure accurate culvert installation costs and optimal execution.
Real-World Application: Driving Business Advantages
In the practical business world, culvert installation, including services like culvert replacement and installation of box culverts, presents tangible benefits. For example, a farm supply business in Ortonville may have its loading area separated by a creek. A well-installed creek culvert would provide a stable and safe crossing for heavy delivery vehicles, contributing to business efficiency and client satisfaction. Similarly, a commercial recreational park in the city opted for a culvert replacement near its entrance, dramatically improving its aesthetic appeal and overall user experience. D&J Contracting completed the work seamlessly with minimal interruption to business operations, reinforcing the importance of choosing experienced culvert installation companies.
The Process of Culvert Installation and Replacement in Ortonville
Installing a culvert in a ditch or as a driveway or drainage solution involves careful planning, execution, and periodic maintenance. Here are the basic steps followed by professionals like D&J Contracting:
1. Site inspection and feasibility analysis
2. Detailed planning, including local council permissions
3. Excavating the area for putting in the culvert
4. Laying the culvert pipe and securing it into a position
5. Backfilling and compacting the excavated area
6. Installing defining features like the concrete culvert pipe ends and box culvert installation.
Similar protocol applies for culvert replacement. An initial inspection will ascertain whether a repair or full replacement is required, with subsequent actions proceeding as per the original installation.
Culvert Installation Costs
Culvert installation cost, including the price to install driveway culverts or storm drain culvert installation, varies considerably depending on factors like culvert type, size, installation complexity, and any related work that needs concurrency. Furthermore, services like culvert replacement cost can differ based on the existing structure’s condition. D&J Contracting provides extensive, competitive quotes encompassing all these considerations, ensuring affordability and transparency.
Whether it’s a new installation, ditch culvert installation, culvert pipe installation near you, or replacing a culvert under a driveway, the process demands expertise and precision. Consequently, business owners should engage organizations with impressive track records like D&J Contracting. Doing so can prevent possible site deterioration and ensure the delivered work is up to existing safety and quality standards.
Overall, well-executed culvert installation provides exceptional business advantages, such as enhanced safety, efficient water management, and improved property aesthetics. As you consider these services for your commercial property in Ortonville, engage with experienced professionals to ensure your installation or replacement is conducted efficiently, thereby yielding maximum benefits for your business.
Culvert Installation Services Gallery


Call Us Today to receive your Free Quote for
Culvert Installation in Ortonville
Serving: Ortonville, Michigan

About Ortonville, Michigan
According to the United States Census Bureau, the village has a total area of 0.98 square miles (2.54 km), all land.
| Census | Pop. | Note | %± |
|---|---|---|---|
| 1880 | 308 | — | |
| 1890 | 313 | 1.6% | |
| 1910 | 377 | — | |
| 1920 | 445 | 18.0% | |
| 1930 | 553 | 24.3% | |
| 1940 | 622 | 12.5% | |
| 1950 | 702 | 12.9% | |
| 1960 | 771 | 9.8% | |
| 1970 | 983 | 27.5% | |
| 1980 | 1,190 | 21.1% | |
| 1990 | 1,252 | 5.2% | |
| 2000 | 1,535 | 22.6% | |
| 2010 | 1,442 | −6.1% | |
| 2020 | 1,376 | −4.6% | |
| U.S. Decennial Census | |||
As of the census of 2010, there were 1,442 people, 511 households, and 376 families living in the village. The population density was 1,471.4 inhabitants per square mile (568.1/km). There were 574 housing units at an average density of 585.7 per square mile (226.1/km). The racial makeup of the village was 95.5% White, 0.6% African American, 0.5% Native American, 1.2% Asian, 0.4% from other races, and 1.8% from two or more races. Hispanic or Latino of any race were 2.6% of the population.
There were 511 households, of which 40.7% had children under the age of 18 living with them, 51.3% were married couples living together, 17.4% had a female householder with no husband present, 4.9% had a male householder with no wife present, and 26.4% were non-families. 21.5% of all households were made up of individuals, and 6.3% had someone living alone who was 65 years of age or older. The average household size was 2.76 and the average family size was 3.18.
The median age in the village was 37.5 years. 27.5% of residents were under the age of 18; 9.5% were between the ages of 18 and 24; 25.8% were from 25 to 44; 30.3% were from 45 to 64; and 7.1% were 65 years of age or older. The gender makeup of the village was 48.7% male and 51.3% female.
As of the census of 2000, there were 1,535 people, 537 households, and 400 families living in the village. The population density was 1,546.2 inhabitants per square mile (597.0/km). There were 572 housing units at an average density of 576.2 per square mile (222.5/km). The racial makeup of the village was 98.24% White, 0.07% African American, 0.46% Native American, 0.39% Asian, 0.46% from other races, and 0.39% from two or more races. Hispanic or Latino of any race were 1.69% of the population.
There were 537 households, out of which 45.8% had children under the age of 18 living with them, 56.2% were married couples living together, 14.7% had a female householder with no husband present, and 25.5% were non-families. 22.5% of all households were made up of individuals, and 7.4% had someone living alone who was 65 years of age or older. The average household size was 2.81 and the average family size was 3.29.
In the village, the population was spread out, with 32.4% under the age of 18, 7.3% from 18 to 24, 35.5% from 25 to 44, 17.5% from 45 to 64, and 7.3% who were 65 years of age or older. The median age was 33 years. For every 100 females, there were 93.6 males. For every 100 females age 18 and over, there were 87.0 males.
The median income for a household in the village was $60,972, and the median income for a family was $72,443. Males had a median income of $59,083 versus $31,250 for females. The per capita income for the village was $24,110. About 3.3% of families and 4.8% of the population were below the poverty line, including 4.0% of those under age 18 and 5.2% of those age 65 or over.
Call Us Today to receive your Free Quote for
Culvert Installation in Ortonville
Related Services in Ortonville, Michigan
We Serve Businesses In The Following Zip Codes:
48007, 48015, 48021, 48026, 48035, 48036, 48038, 48042, 48043, 48044, 48045, 48046, 48047, 48048, 48050, 48051, 48066, 48071, 48080, 48081, 48082, 48083, 48084, 48085, 48088, 48089, 48090, 48091, 48092, 48093, 48098, 48099, 48225, 48230, 48236, 48310, 48311, 48312, 48313, 48314, 48315, 48316, 48317, 48318, 48397