Asphalt vs Concrete Troy Michigan
We Are Locally Owned
& Operated For 36 Years
Contact Us Today!
About Asphalt vs Concrete
Introduction
The topic of Asphalt vs Concrete is one that engages homeowners, commercial property owners, city planners, and builders alike. Choosing the right material for driveways, walkways, parking lots, and other paved areas can make a significant difference in terms of cost, durability, aesthetic appeal, maintenance, and environmental impact. This comprehensive guide aims to illuminate the crucial aspects of this seemingly simple, yet vitally important decision that can influence your property’s value, usage, and appeal. Moreover, we will delve into supporting aspects, such as the cost disparity between black top driveway vs concrete, driveway paving, and more.
Asphalt vs Concrete- A Comparative Overview
Choosing between asphalt and concrete involves considering various factors. While cost tends to be a primary concern (as indicated by the continuous debate around asphalt driveway cost vs concrete), it’s essential to note that both materials have distinct features, pros, and cons. Let’s break these down to understand better where each has an upper hand over the other.
Asphalt- Pros and Cons
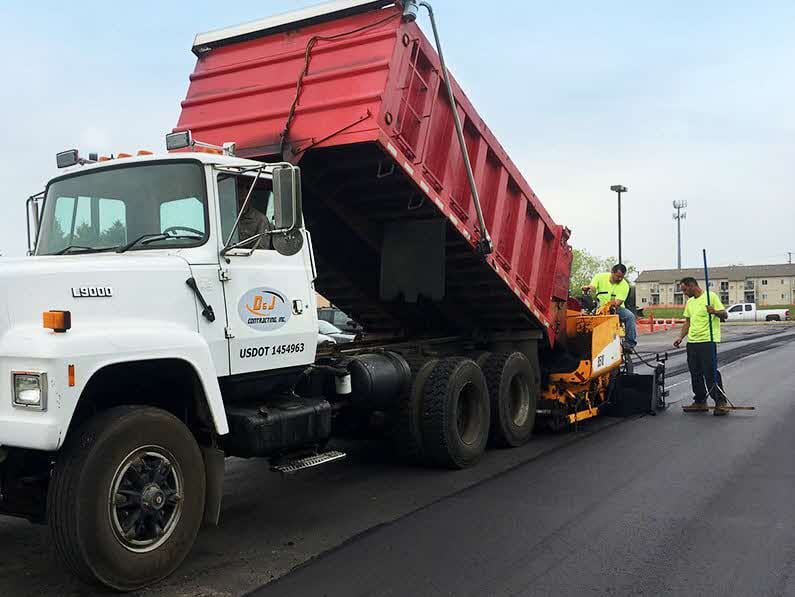
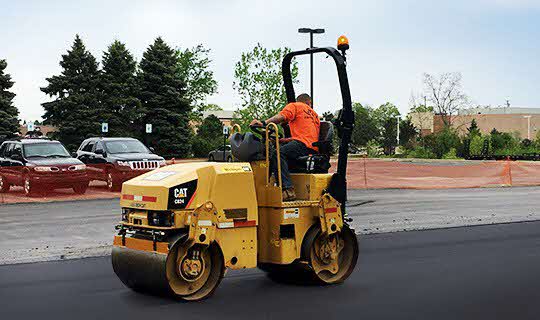
Commonly referred to as blacktop, asphalt is a popular choice for many homeowners and commercial property owners. Factors like the lower cost of blacktop vs concrete driveway cost, quicker installation time, and adaptability to colder climates often tip the scales in favor of asphalt. However, it is worth mentioning that asphalt requires more frequent maintenance and has a shorter lifespan than concrete, which might result in higher long-term costs.
Concrete- Pros and Cons
On the other side of the debate, concrete offers high durability, longevity, and low maintenance. Concrete’s versatility in terms of aesthetic options, such as staining and stamping, can turn mundane pathways and driveways into style statements. Its lighter color can keep the surface cooler in hot weather. However, the cost of asphalt vs concrete leans towards the pricier side for the latter, becoming a deterrent for those with budgetary constraints. While concrete fares excellent in hot weather, it might not be the best choice for locations prone to extreme winters, as it can be subject to cracking due to freeze-thaw cycles.
Comparing Costs
Understanding the cost implications of the two materials is a critical aspect of this blacktop vs concrete discussion. Generally, an asphalt driveway tends to be cheaper concerning upfront costs, making it an attractive choice for those with tight budgets. The cost of blacktop vs concrete can be around a third to half cheaper. However, this doesn’t account for the ongoing maintenance costs of sealing that asphalt requires every few years. On the other hand, concrete driveways are more expensive to install but require less maintenance.
Concrete vs Pavement Driveway
When discussing concrete vs pavement driveways, we essentially refer to the contrast between using concrete or asphalt (commonly referred to as pavement). Factors like cost, local weather conditions, use, and personal preference come into play when choosing between the two. Differences are also noticeable in terms of aesthetics; for instance, a paver driveway can add an upscale decorative element to your property.
Driveway Paving vs Concrete
When comparing driveway paving vs concrete, another significant point of comparison is durability. Concrete is typically more robust and lasts longer with less maintenance. Asphalt, on the other hand, may wear down more rapidly, especially under heavy use, and require more frequent touch-ups.
Asphalt vs Paver Driveway
Asphalt and paving stones (or pavers) offer contrasting aesthetic experiences. While asphalt offers a smooth, sleek black surface, paver driveways provide a higher degree of customization and decorative potential. However, the trade-off includes increased cost and installation time.
Conclusion
In conclusion, the Asphalt vs Concrete debate is one of balancing factors such as upfront costs, longevity, maintenance requirements, and aesthetics. Each has advantages and disadvantages depending on the context of use and personal preferences. While choosing the right material is indeed paramount, it’s equally important to remember that a well-maintained driveway or pathway, whatever the material, is a significant contributing factor in enhancing the curb appeal and value of your property.
If you’re looking for professional assistance to navigate these options and make a well-informed decision, we encourage you to get in touch. Our team has the experience, local knowledge, and technical expertise to guide you towards the most effective solution for your paving needs.
Contact Us Today for a FREE
Asphalt vs Concrete Quote


About Troy, Michigan
History
The earliest recorded purchases of land in what was known as Troy Township occurred in 1819. A couple of years later a settlement known as Troy Corners was established due to Johnson Niles buying 160 acres in the region. The area is currently the north-central area of Troy. In 1827 Troy Township was established. In 1955, Troy was officially incorporated primarily as a strategy for preventing border cities from taking more land. This also helped to establish more robust city services for Troy residents, whose numbers increased rapidly during this time due to Detroiters fleeing the City for the surrounding suburbs.
It was named after Troy, New York, and the ancient city of Troy, as many of the early settlers, as in much of Michigan, originated from New York.
Geography
According to the United States Census Bureau, the city has a total area of 33.64 square miles (87.13 km), of which 33.47 square miles (86.69 km2) is land and 0.17 square miles (0.44 km) (0.51%) is water.
Climate
Demographics
| Census | Pop. | Note | %± |
|---|---|---|---|
| 1960 | 19,402 | — | |
| 1970 | 39,419 | 103.2% | |
| 1980 | 67,102 | 70.2% | |
| 1990 | 72,884 | 8.6% | |
| 2000 | 80,959 | 11.1% | |
| 2010 | 80,980 | 0.0% | |
| 2020 | 87,294 | 7.8% | |
| U.S. Decennial Census 2018 Estimate |
|||
According to a 2018 estimate, the median income for a household in the city was $96,864, and the median income for a family was $113,640. Males had a median income of $72,005 versus $52,365 for females. The per capita income for the city was $46,664. About 5.1% of families and 7.2% of the population were below the poverty line, including 6.7% of those under age 18 and 6.1% of those age 65 or over.
2020 census
As of the census of 2020, there were 87,294 people, 33,822 households, and 24,300 families living in the city. The population density was 2,609.9 inhabitants per square mile (1,007.7/km). There were 34,953 housing units at an average density of 1,044.9 inhabitants per square mile (403.4/km2). The racial makeup of the city was 62.2% White, 4.0% African American, 0% Native American, 27.3% Asian, 1.2% from other races, and 5.1% from two or more races. Hispanic or Latino residents of any race were 2.2% of the population.
There were 33,822 households, of which 35.4% had children under the age of 18 living with them, 60.1% were married couples living together, 8.3% had a female householder with no husband present, 3.4% had a male householder with no wife present, and 28.2% were non-families. 23.2% of all households were made up of individuals, and 10.1% had someone living alone who was 65 years of age or older. The average household size was 2.56 and the average family size was 3.05.
The median age in the city was 43.9 years. 20.7% of residents were under the age of 18; 8.8% were between the ages of 18 and 24; 32% were from 25 to 44; 28.6% were from 45 to 64; and 19.7% were 65 years of age or older. The gender makeup of the city was 50.5% male and 49.5% female.
| Race / Ethnicity (NH = Non-Hispanic) | Pop 2000 | Pop 2010 | Pop 2020 | % 2000 | % 2010 | % 2020 |
|---|---|---|---|---|---|---|
| White alone (NH) | 65,809 | 58,869 | 53,793 | 81.29% | 72.70% | 61.62% |
| Black or African American alone (NH) | 1,678 | 3,210 | 3,422 | 2.07% | 3.96% | 3.92% |
| Native American or Alaska Native alone (NH) | 105 | 124 | 108 | 0.13% | 0.15% | 0.12% |
| Asian alone (NH) | 10,713 | 15,439 | 23,788 | 13.23% | 19.07% | 27.25% |
| Pacific Islander alone (NH) | 18 | 1 | 9 | 0.02% | 0.00% | 0.01% |
| Other race alone (NH) | 79 | 125 | 312 | 0.10% | 0.15% | 0.36% |
| Mixed race or Multiracial (NH) | 1,373 | 1,502 | 2,908 | 1.70% | 1.85% | 3.33% |
| Hispanic or Latino (any race) | 1,184 | 1,710 | 2,954 | 1.46% | 2.11% | 3.38% |
| Total | 80,959 | 80,980 | 87,294 | 100.00% | 100.00% | 100.00% |
2010 census
As of the census of 2010, there were 80,980 people, 30,703 households, and 22,443 families living in the city. The population density was 2,419.5 inhabitants per square mile (934.2/km2). There were 32,907 housing units at an average density of 983.2 per square mile (379.6/km). The racial makeup of the city was 74.1% White, 4.0% African American, 0.2% Native American, 19.1% Asian, 0.6% from other races, and 2.0% from two or more races. Hispanic or Latino residents of any race were 2.1% of the population.
There were 30,703 households, of which 34.7% had children under the age of 18 living with them, 62.8% were married couples living together, 7.3% had a female householder with no husband present, 3.0% had a male householder with no wife present, and 26.9% were non-families. 23.4% of all households were made up of individuals, and 9.6% had someone living alone who was 65 years of age or older. The average household size was 2.63 and the average family size was 3.14.
The median age in the city was 41.8 years. 23.8% of residents were under the age of 18; 6.7% were between the ages of 18 and 24; 24% were from 25 to 44; 31.6% were from 45 to 64; and 13.8% were 65 years of age or older. The gender makeup of the city was 49.3% male and 50.7% female.
2000 census
From the census of 2000, there were 80,959 people, 30,018 households, and 21,883 families living in the city. The population density was 2,413.9 inhabitants per square mile (932.0/km). There were 30,872 housing units at an average density of 920.5 per square mile (355.4/km2). The racial makeup of the city was 82.30% White, 2.09% African American, 0.15% Native American, 13.25% Asian, 0.02% Pacific Islander, 0.36% from other races, and 1.82% from two or more races. 1.46% of the population was Hispanic or Latino of any race.
There were 30,018 households, out of which 36.9% had children under the age of 18 living with them, 64.5% were married couples living together, 6.0% had a female householder with no husband present, and 27.1% were non-families. 22.8% of all households were made up of individuals, and 7.8% had someone living alone who was 65 years of age or older. The average household size was 2.69 and the average family size was 3.23.
In the city 26.2% of the population was under the age of 18, 6.7% from 18 to 24, 29.8% from 25 to 44, 27.1% from 45 to 64, and 10.2% who were 65 years of age or older. The median age was 38 years. For every 100 females, there were 98.1 males. For every 100 females age 18 and over, there were 94.8 males.
From 1990 to 2000, of all of the municipalities in Oakland, Wayne, and Macomb counties, Troy had the highest numeric growth in the Asian population. It had 4,932 Asians according to the 1990 U.S. Census and 10,730 according to the 2000 U.S. Census, an increase of 5,798. The increase gave Troy the largest Asian-American population in the tri-county area, surpassing that of Detroit.
Government
Troy uses the Council-Manager form of government, and thus is governed by a City Council consisting of a mayor and six council members. The current mayor is Ethan Baker, who was elected to a four-year term on November 5, 2019. The city council appoints a City Manager, who manages the day-to-day operations of the city.
The City of Troy and City of Clawson on its southern border compose Michigan’s 41st District for State Representative. The district is currently represented by Padma Kuppa in the State House since 2019, and in the state Senate by Mallory McMorrow, since 2019. The district was previously represented in the State House by Martin Howrylak since 2013, and in the state Senate by Marty Knollenberg, since 2015. On the national level, Troy was part of the 9th district, represented by Joe Knollenberg from 1993 to 2009 and Gary Peters, who defeated Knollenberg in a highly publicized race in November 2008. Nationally, Troy is part of the 11th district, held by Democrat Haley Stevens.
Education
Colleges and universities
Troy is the location of Walsh College, a business school, as well as branches of the University of Phoenix, Northwood University, Central Michigan University, Spring Arbor University, International Academy of Design and Technology, and Michigan State University.
Primary and secondary schools
There are 7 different school districts serving the city of Troy; however, Troy School District serves the majority of the limits. The district has multiple elementary schools, four middle schools, and two zoned high schools: Troy High School and Athens High School.
There are also three school districts that have sizable portions of territory in Troy and that operate at least one elementary school within the city; these are Avondale School District, in the north and northwest most portion of the city, Birmingham City School District, in the southwest most portion, and Warren Consolidated Schools, in the southeast, which operates Susick Elementary within the city. These districts operate Woodland Elementary, Pembroke Elementary, and Susick Elementary, respectively.
In addition, there are two other school districts within the city that have residential territory there, those being Bloomfield Hills School District, with a portion of the northwest part of the city, and Royal Oak School District, which has a very small portion of the southern part of the city. Finally, a small area of commercial property[citation needed] also in the south lies within the borders of Lamphere Public Schools
The Troy School District also hosts the eastern campus of the International Academy, currently ranked 7th in the Newsweek rankings of the best public high schools in the United States. The school has been located in the older Baker Middle School building since the beginning of the 2008–2009 academic year. Previously, Troy sent students through the class of 2011 to the central IA campus in Bloomfield Hills.
Private schools:
- Bethany Christian School
- Brookfield Academy
- Oakland Children’s Academy
- St. Mark Christian Academy
- Troy Adventist Academy
Contact Us Today for a FREE
Asphalt vs Concrete Quote
Our Asphalt vs Concrete services are available in Troy as well as all of Oakland County.
Our dedicated team at D&J Contracting Inc is at-the-ready to provide you with great customer service and first class Asphalt vs Concrete services. Reach out to us at (586) 954-0008 to discuss your Asphalt vs Concrete needs today!